
Data science project / Spring 2024
Influenza Trends Study
A Python analysis of seasonal mortality patterns and influenza-and-pneumonia deaths in the United States from 2014 to 2019.
For EK 120, I used final monthly death counts from the CDC's National Center for Health Statistics to examine how mortality changed through the year. The analysis compared monthly totals, ranked cause-specific differences between February and August, and checked whether the 2019 influenza-and-pneumonia profile showed an unusual late-year increase.
- Course
- BU EK 120
- Period
- Spring 2024
- Format
- Individual data-analysis project
- Dataset
- 72 monthly U.S. records, 2014-2019
- Tools
- Python, Jupyter, pandas, and Matplotlib
Monthly mortality pattern
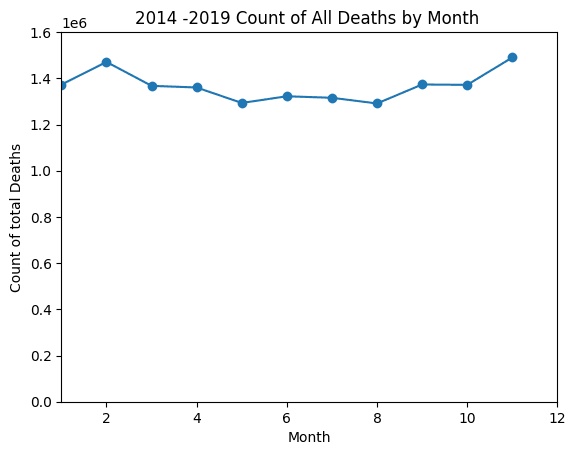
Summing each calendar month across the six-year dataset made the seasonal pattern visible. Death counts were generally higher in winter, declined through spring, reached their lowest range in late spring and summer, and rose again toward the end of the year.
December had the highest combined count in the plotted data, followed closely by February. The chart reports raw totals, so it describes the dataset directly without adjusting for month length or population change.
Analysis questions
Monthly mortality pattern
Grouped all six years by month and summed all-cause deaths to compare the annual pattern.
February-August comparison
Calculated the direction and relative size of each cause's change between a winter and summer month, then ranked the largest differences.
2019 influenza context
Separated influenza-and-pneumonia deaths from the all-cause total and compared the 2019 profile with the six-year monthly average.
Cause-specific seasonal patterns
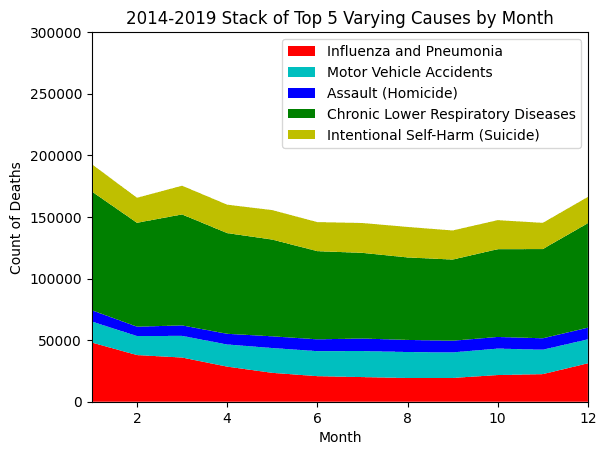
The cause-level view separated five categories with pronounced seasonal differences. Influenza and pneumonia and chronic lower respiratory disease were higher in winter. Motor-vehicle deaths, homicide, and suicide increased toward the warmer months in this aggregation.
February and August comparison
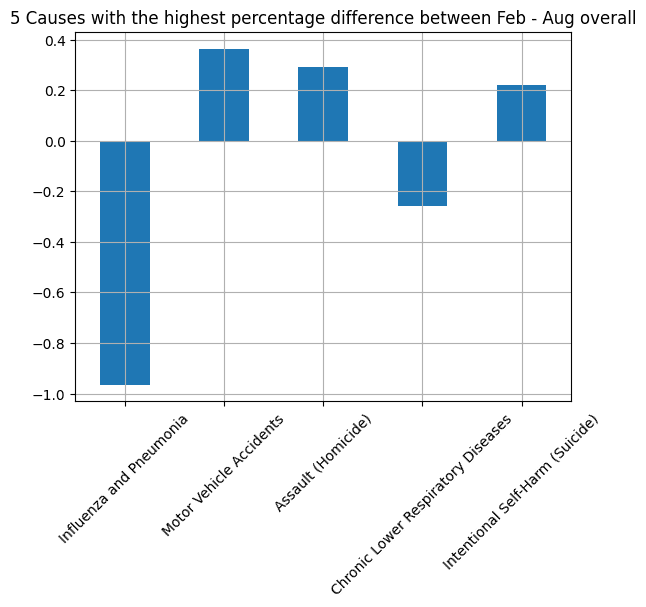
February and August were used as winter and summer reference points. Influenza and pneumonia showed the largest decline, while chronic lower respiratory disease also decreased. Motor-vehicle deaths, homicide, and suicide moved in the opposite direction.
This calculation ranked the magnitude and direction of the aggregate difference. It was an exploratory comparison, not a statistical test of whether season alone caused the change.
2019 influenza comparison
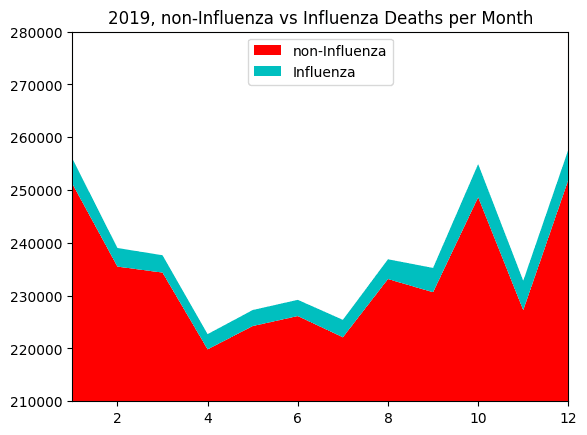
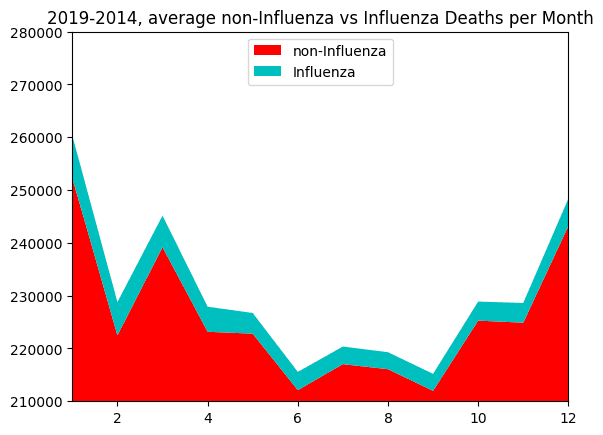
The final analysis compared the monthly shape of 2019 with the 2014-2019 average. In both charts, influenza-and-pneumonia deaths were separated from the remaining all-cause total so the cyan area could be read as its own category.
The 2019 series followed the broader seasonal pattern and did not show a clear abnormal increase in influenza-and-pneumonia deaths at the end of the year. This was a visual, descriptive result; it did not establish statistical significance or test for the presence of a specific disease.
Dataset and method
The source contained final U.S. death counts for each month from 2014 through 2019, including all-cause mortality and selected causes. The analysis used all 72 national monthly records.
View the CDC dataset (opens in a new tab)- Import
- Loaded the CDC CSV directly into a pandas DataFrame.
- Aggregate
- Grouped records by month and summed counts across 2014-2019.
- Compare
- Calculated February-August relative changes and sorted causes by magnitude.
- Visualize
- Used line, stacked-area, and bar charts to compare totals and cause-specific patterns.
- Interpret
- Kept conclusions descriptive and tied them to the range represented in the dataset.
Limits and next steps
The project used raw national counts. It did not normalize for the number of days in each month, population growth, or changes in age distribution. The six-year comparison also included 2019 in its average, so it was context rather than an independent pre-2019 baseline.
A stronger follow-up would calculate rates, compare 2019 only with 2014-2018, add confidence intervals or a formal anomaly test, and evaluate whether the observed seasonal differences remain after those adjustments.