
Statistics project / Fall 2023
Phone-Charging Habits Statistical Study
A survey study of how phone-charging behavior relates to battery level, self-reported organization, and academic habits.
For MA 213, our team surveyed Boston University students about their current phone battery, overnight charging, recent zero-battery incidents, phone model, organization, preparedness, and GPA. We used descriptive statistics, correlation, and hypothesis testing to evaluate whether charging behavior could be associated with broader organization habits.
- Course
- BU MA 213
- Period
- Fall 2023
- Format
- Team survey and statistical analysis
- Sample
- Up to 145 BU-student responses
- Methods
- Questionnaire design, correlation, and hypothesis testing
Research design
The questionnaire combined demographic, numerical, ordinal, and categorical items. That structure allowed the study to compare a phone's measured state at the time of response with repeated charging behavior and self-reported personal habits.
Demographic
Class year and gender
Phone state
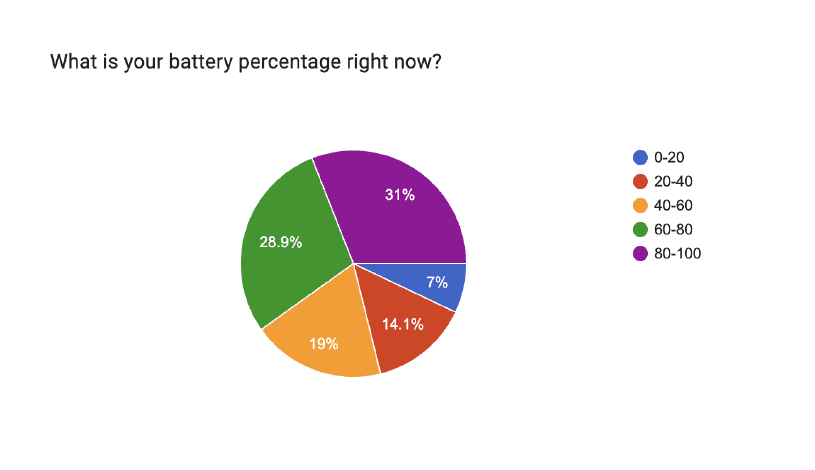
Current battery percentage, phone model, and portable-charger use
Charging behavior
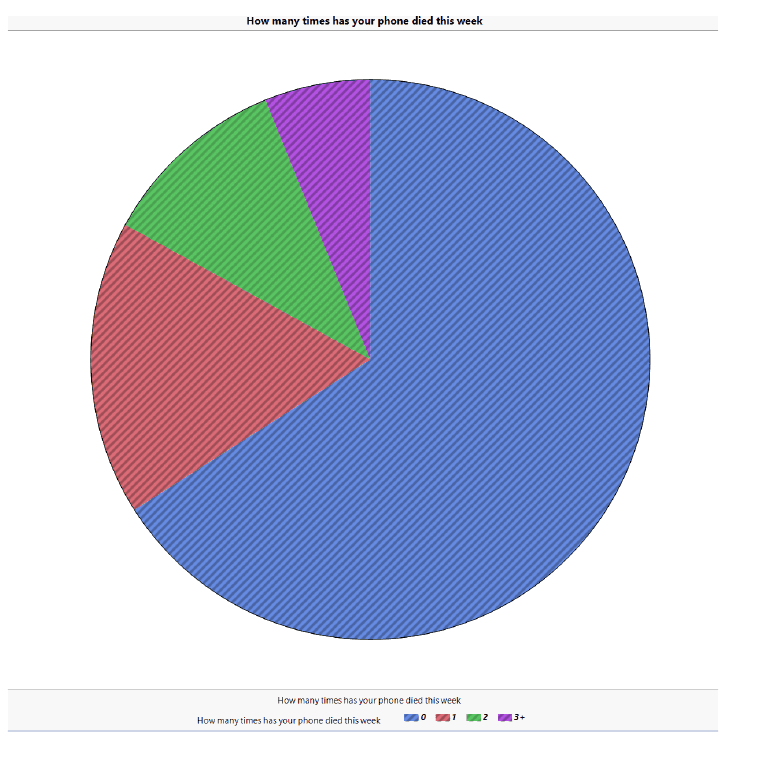
Overnight charging frequency and times the phone died in the previous week
Self-assessment
Organization, preparedness, schedule status, and GPA
Survey revision and collection
An initial round produced approximately 30 valid responses and exposed problems in the wording. For example, some respondents interpreted "phone model" as an operating-system version. The question was revised with a concrete example so the variable would be recorded more consistently.
The survey originally requested names and email addresses. Those fields were removed to make the questionnaire anonymous and reduce pressure around self-ratings of organization and academic behavior. The revised survey was distributed through QR codes, links, campus locations, and student social networks.
Response distributions
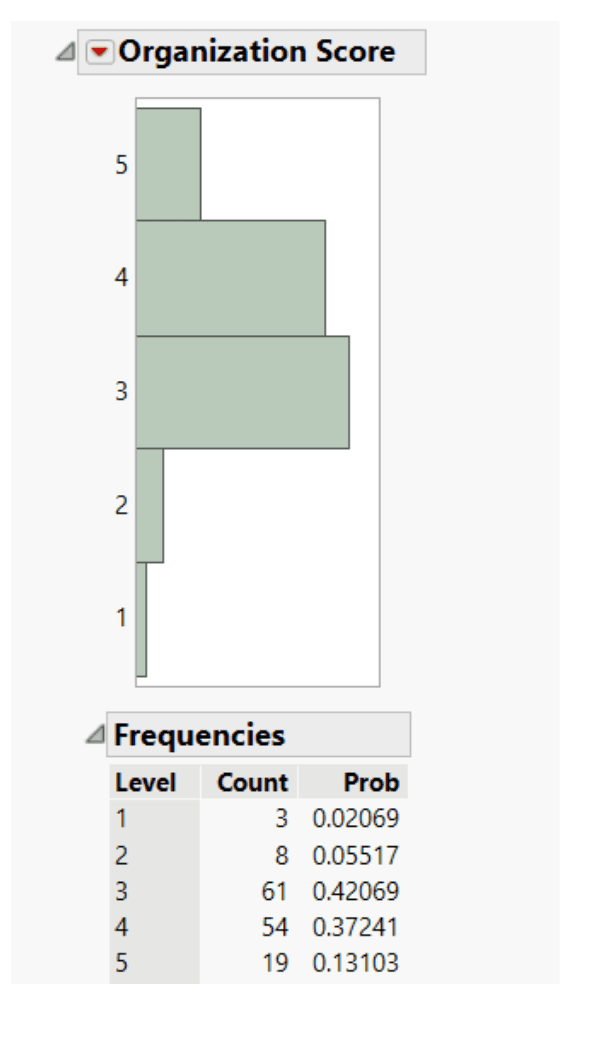
The organization item contained 145 valid responses. Ratings of 3 and 4 accounted for most of the sample: 61 respondents selected 3 and 54 selected 4. The report treated this ordinal distribution as non-normal and concentrated toward the organized end of the scale.
Organization and phone-dying frequency
The descriptive probability of a phone dying at least once during the week generally fell as organization scores increased. The pattern was not perfectly monotonic at the low end, but ratings 3 through 5 showed a consistent decline from 41% to 19%.
| Organization rating | Phone died at least once |
|---|---|
| 1 | 50% |
| 2 | 53% |
| 3 | 41% |
| 4 | 26% |
| 5 | 19% |
Statistical findings
The results were mixed. Several descriptive patterns matched the team's expectations, but the inferential results did not support every proposed relationship.
Organization and current battery
The sample correlation was weak and positive (R = 0.25), but the hypothesis test did not provide sufficient evidence of a relationship.
Organization and phone dying
The descriptive probability of a phone dying at least once generally decreased as self-reported organization increased.
Overnight charging
The survey supported an association between more frequent overnight charging and maintaining a higher battery level or running out less often.
Battery level and GPA
The final report did not find a statistically significant correlation between a student's current phone battery percentage and GPA.
Limits and next steps
The sample was recruited through campus locations, personal networks, and social media rather than a controlled probability sample. About 40% of respondents were sophomores, and the survey's location and social-network distribution could have overrepresented nearby or residential students.
Current battery percentage was also a one-time measurement affected by phone model, battery age, recent use, and time of day. Organization, GPA, and charging habits were self-reported. A follow-up study should control for device model and age, collect repeated battery measurements, broaden recruitment, and use a validated organization measure.